.svg)



8 Best Qualitative Data Analysis Tools for Research Teams

Qualitative data is rich, but it can be difficult to organize when your team has interviews, focus groups, open-ended survey responses, call transcripts, customer feedback, and research notes scattered across different places.
Qualitative data analysis tools help you code, organize, compare, summarize, and report themes faster without losing the context behind each quote.
In this article, we’ll cover eight qualitative data analysis tools by use case. You’ll see QDA (Qualitative Data Analysis) software, AI-assisted synthesis tools, research repositories, visual coding tools, and mixed-method research systems.
TL;DR
These are the best qualitative data analysis tools to compare in 2026:
- Compeers AI — Custom market research and AI-assisted reporting
- NVivo — Advanced QDA software for complex research projects
- ATLAS.ti — Multimodal qualitative analysis and visualization
- MAXQDA — Mixed-method research and statistical analysis
- Dovetail — Research repository and customer feedback synthesis
- Delve — Simple transcript coding and thematic analysis
- Dedoose — Cloud-based mixed methods collaboration
- Quirkos — Visual coding with a lower learning curve
8 Best Qualitative Data Analysis Tools
Qualitative data analysis software can support a wide range of research tasks. The tools below are grouped by the type of workflow they support best.
1. Compeers AI — Custom Market Research and AI-Assisted Reporting
Compeers AI is a human-led, AI research system for custom market research that connects qualitative data analysis with planning, data collection, synthesis, and first-draft reporting.
It’s built for research teams that need more than standalone QDA tools because qualitative findings often need to connect with survey data, segmentation work, stakeholder questions, and final reports.
For qualitative research, Compeers AI supports the creation of discussion guides, secure audio and video interviews, multilingual transcription and translation, thematic coding, sentiment analysis, conversational FAQs, and narrative reporting.
It also supports executive summaries, presentations, and memos, so your team can move from research materials to stakeholder-ready outputs with less manual rewriting.
Compeers AI is especially relevant for market research teams that need to analyze interviews, focus groups, open-ended responses, and mixed-method data while keeping researcher control over the final interpretation.
It supports qualitative analysis as part of the broader research process, so your team can connect planning, fieldwork, data analysis, reporting, and knowledge reuse in one research workflow.
Key Features
- Creates discussion guides aligned with business objectives and research questions.
- Supports secure audio and video interviewing with multilingual transcription.
- Uses thematic coding and sentiment analysis to organize qualitative findings.
- Produces first-draft deliverables such as summaries, memos, and presentations.
How Compeers AI Analyzes Qualitative Data
Compeers AI analyzes qualitative data by keeping the research objective, source material, coding, synthesis, and reporting connected in one workflow.
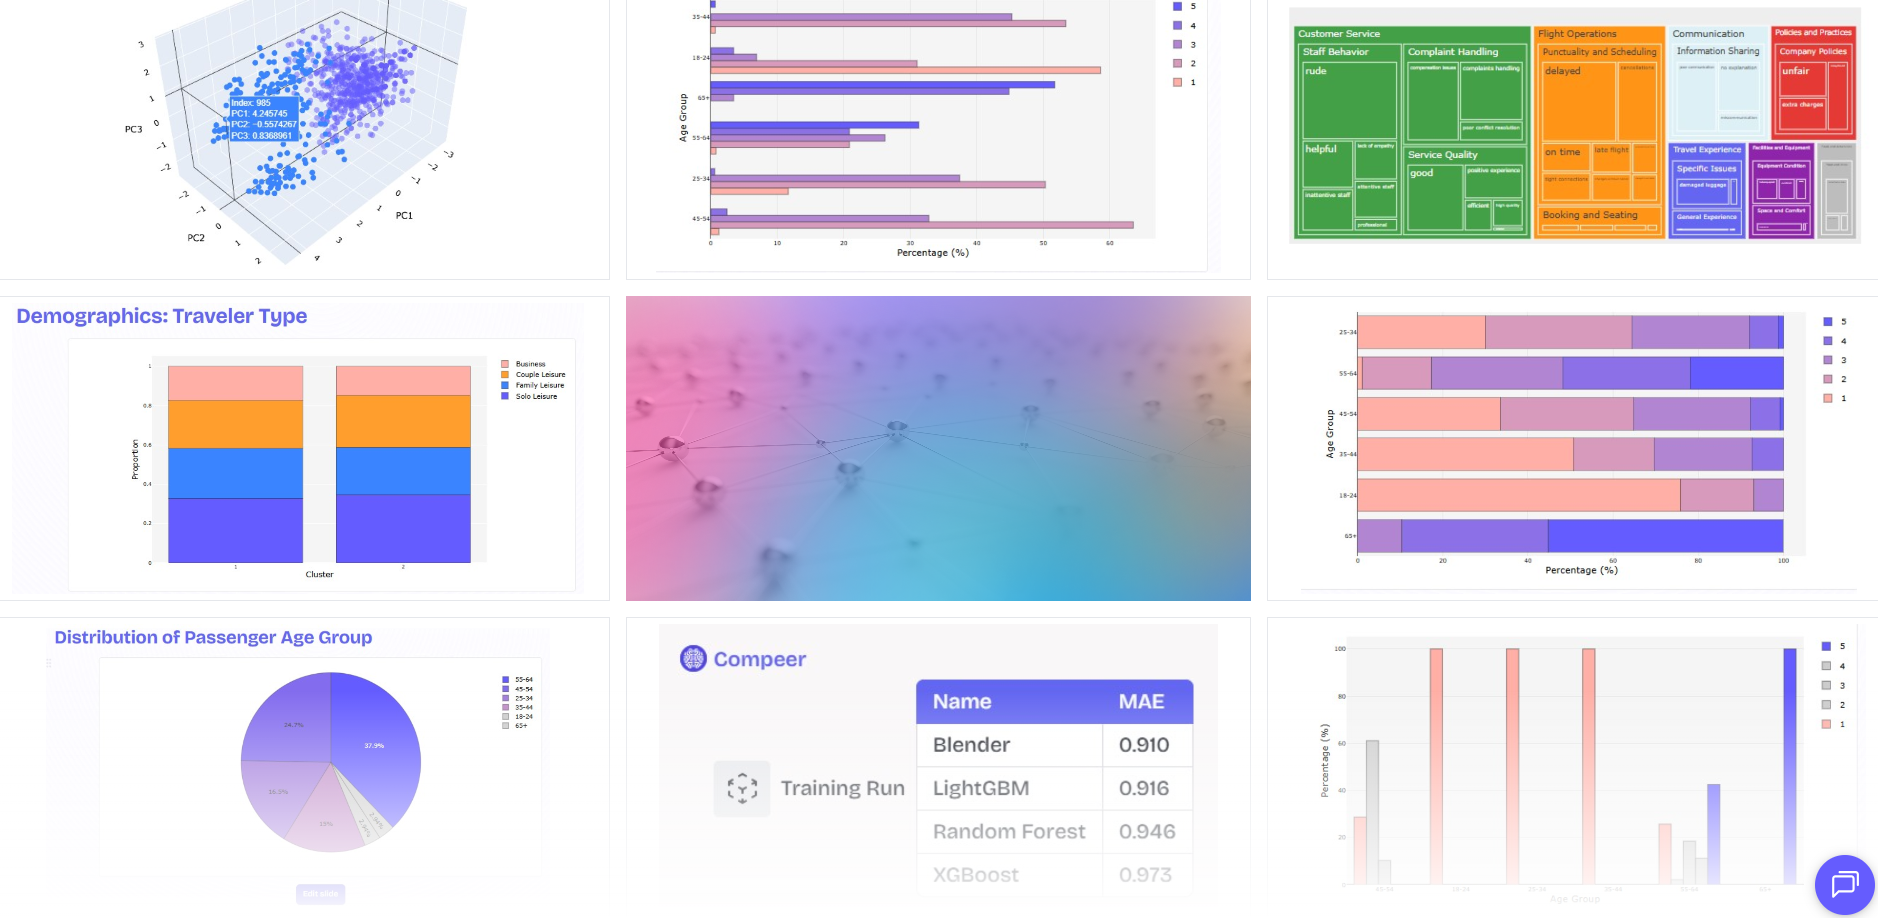
Your team can move from interviews, focus groups, open-ended responses, and research notes into themes, sentiment, summaries, and first-draft reports without losing traceability.
- Set up the project around the research question, audience, and decision your team needs to support.
- Import or collect transcripts, notes, recordings, open-ended survey answers, and other qualitative inputs.
- Use thematic coding, sentiment analysis, and pattern detection to organize findings.
- Review AI-assisted outputs and turn the analysis into reports, summaries, and stakeholder-ready narratives.
Book a demo to see how Compeers AI turns qualitative data into clear, traceable research findings!
2. NVivo — Advanced QDA Software for Complex Research Projects
NVivo is qualitative data analysis software for researchers who need deep coding, querying, visualization, and mixed-method analysis. It supports interviews, open-ended surveys, documents, audio, video, and multimedia data in a single workspace, with AI assistance for early coding and analysis.

NVivo suits research teams that need a formal QDA software environment for complex projects, university research, evaluation work, health research, public policy, and social scientists.
It gives you manual coding, cases, attributes, memos, annotations, queries, mixed-methods tools, word frequencies, cluster maps, diagrams, and statistical plots.
Key Features
- Organizes interviews, documents, survey data, audio, video, and other research materials.
- Supports coding, cases, attributes, memos, annotations, and advanced query tools.
- Adds quantitative context through coding frequencies, comparisons, and descriptive statistics.
- Connects with Microsoft Office, Citavi, Qualtrics, SurveyMonkey, and XLSTAT.
How NVivo Analyzes Qualitative Data
NVivo analyzes qualitative data by helping your team import unstructured materials, organize them into a project, code evidence, and run deeper queries.
It supports text, documents, audio, video, surveys, cases, attributes, memos, annotations, visualizations, and mixed-method analysis.
- Import interviews, open-ended survey data, documents, audio, video, and other research materials.
- Create codes, cases, folders, memos, and annotations to structure the project.
- Run queries, word frequency checks, matrices, and comparisons to test patterns.
- Use charts, maps, models, and exports to turn coded data into research outputs.
3. ATLAS.ti — Multimodal Qualitative Analysis and Visualization
ATLAS.ti is QDA software for organizing, coding, analyzing, and reporting qualitative data from text, PDFs, images, audio, video, geo data, surveys, and social content. It supports desktop work on Mac and Windows, plus a browser version for teams that want web access.
ATLAS.ti is useful when your team needs qualitative text analysis, literature reviews, interview analysis, focus group analysis, UX research, customer feedback analysis, or mixed methods projects.
It can import Word documents, PDFs, survey data, reference manager data, images, audio, video, and social network comments.
The software provides a flexible interface with coding tools, AI-suggested code, AI summaries, conversational AI, and visual outputs such as bar charts, Sankey diagrams, word clouds, and network views.
Key Features
- Imports text, PDFs, images, audio, video, geo data, survey files, and reference data.
- Supports AI Coding, AI Suggested Codes, AI Summaries, and document chat.
- Runs on native Mac and Windows versions with ATLAS.ti Web for browser access.
- Visualizes qualitative analysis with networks, word clouds, charts, and Sankey diagrams.
How ATLAS.ti Analyzes Qualitative Data
ATLAS.ti analyzes qualitative data by bringing multiple data types into one research workspace for coding, memoing, AI-assisted analysis, and visualization.
Your team can work with text, PDFs, images, audio, video, survey data, literature files, and social content.
- Import documents, transcripts, PDFs, images, audio, video, surveys, and reference files.
- Apply manual codes, AI-suggested codes, comments, memos, and linked quotations.
- Use AI summaries, document chat, and search tools to explore patterns faster.
- Build networks, Sankey diagrams, word clouds, charts, and reports from coded material.
4. MAXQDA — Mixed Method Research and Statistical Analysis
MAXQDA is qualitative data analysis software for mixed methods research, statistical analysis, quantitative text analysis, transcription, visualization, and detailed coding workflows. It supports text, PDFs, transcripts, focus groups, audio, video, survey data, spreadsheets, websites, YouTube comments, images, emails, and literature data.
Research teams choose MAXQDA when they need depth and structure for complex projects that combine qualitative methods with survey data or standardized variables.
It can import SurveyMonkey data, Excel files, SPSS datasets, and focus group transcripts with automatic speaker detection.
MAXQDA also provides your team with tools for coded data search, classification, linking, logbooks, summaries, creative coding, automatic coding, group comparison, code patterns, code coverage, sentiment analysis, and mixed-methods analysis.
Key Features
- Imports transcripts, focus group files, survey data, spreadsheets, websites, images, audio, and video.
- Uses speaker-based tools for focus group transcripts and multi-speaker analysis.
- Supports sentiment analysis, automatic coding, code patterns, and search for coded data.
- Combines qualitative and quantitative data through crosstabs, typology tables, and group comparisons.
How MAXQDA Analyzes Qualitative Data
MAXQDA analyzes qualitative data by combining coding, transcription, visualization, mixed-methods comparison, and statistical analysis in one research environment.
It supports interviews, focus group transcripts, survey data, websites, images, audio, video, spreadsheets, and social media data.
- Import transcripts, survey responses, documents, images, audio, video, websites, and spreadsheets.
- Code text, attach memos, create summaries, and compare coded segments.
- Analyze focus group speakers, variables, code patterns, sentiment, and coded data coverage.
- Use crosstabs, quote matrices, charts, maps, and mixed-method views to report findings.
5. Dovetail — Research Repository and Customer Feedback Synthesis
Dovetail is a customer intelligence and research repository tool for product, UX, marketing, customer experience, sales, and customer success teams. It turns customer feedback, surveys, tickets, docs, calls, and research conversations into dashboards, reports, searchable evidence, and AI-supported summaries.

Dovetail suits teams that need to centralize qualitative research and customer feedback from many projects.
You can use it to tag highlights, search previous research, monitor feedback themes, create reports, and connect customer evidence to product decisions.
Its biggest value lies in research memory and synthesis rather than formal academic coding.
Key Features
- Turns surveys, tickets, docs, and conversations into structured customer intelligence.
- Uses AI Chat and semantic search to answer questions from project data.
- Creates dashboards for sentiment, feedback themes, NPS, CSAT, and customer signals.
- Produces summaries, structured reports, and reels from customer evidence.
How Dovetail Analyzes Qualitative Data
Dovetail analyzes qualitative data by turning customer conversations, research notes, survey responses, tickets, and calls into searchable evidence.
Teams can tag highlights, create summaries, ask AI questions, build dashboards, and connect findings back to the source material.
- Import or centralize interviews, feedback, support tickets, surveys, calls, and research notes.
- Highlight key moments and tag them by theme, customer type, journey stage, or research question.
- Use AI chat and semantic search to ask questions and find evidence inside project data.
- Create insights, dashboards, reports, summaries, and reels for product or customer teams.
6. Delve — Simple Transcript Coding and Thematic Analysis
Delve is qualitative data analysis software for coding transcripts, building themes, organizing quotes, and supporting research methods such as thematic analysis, grounded theory, content analysis, narrative analysis, and mixed methods.
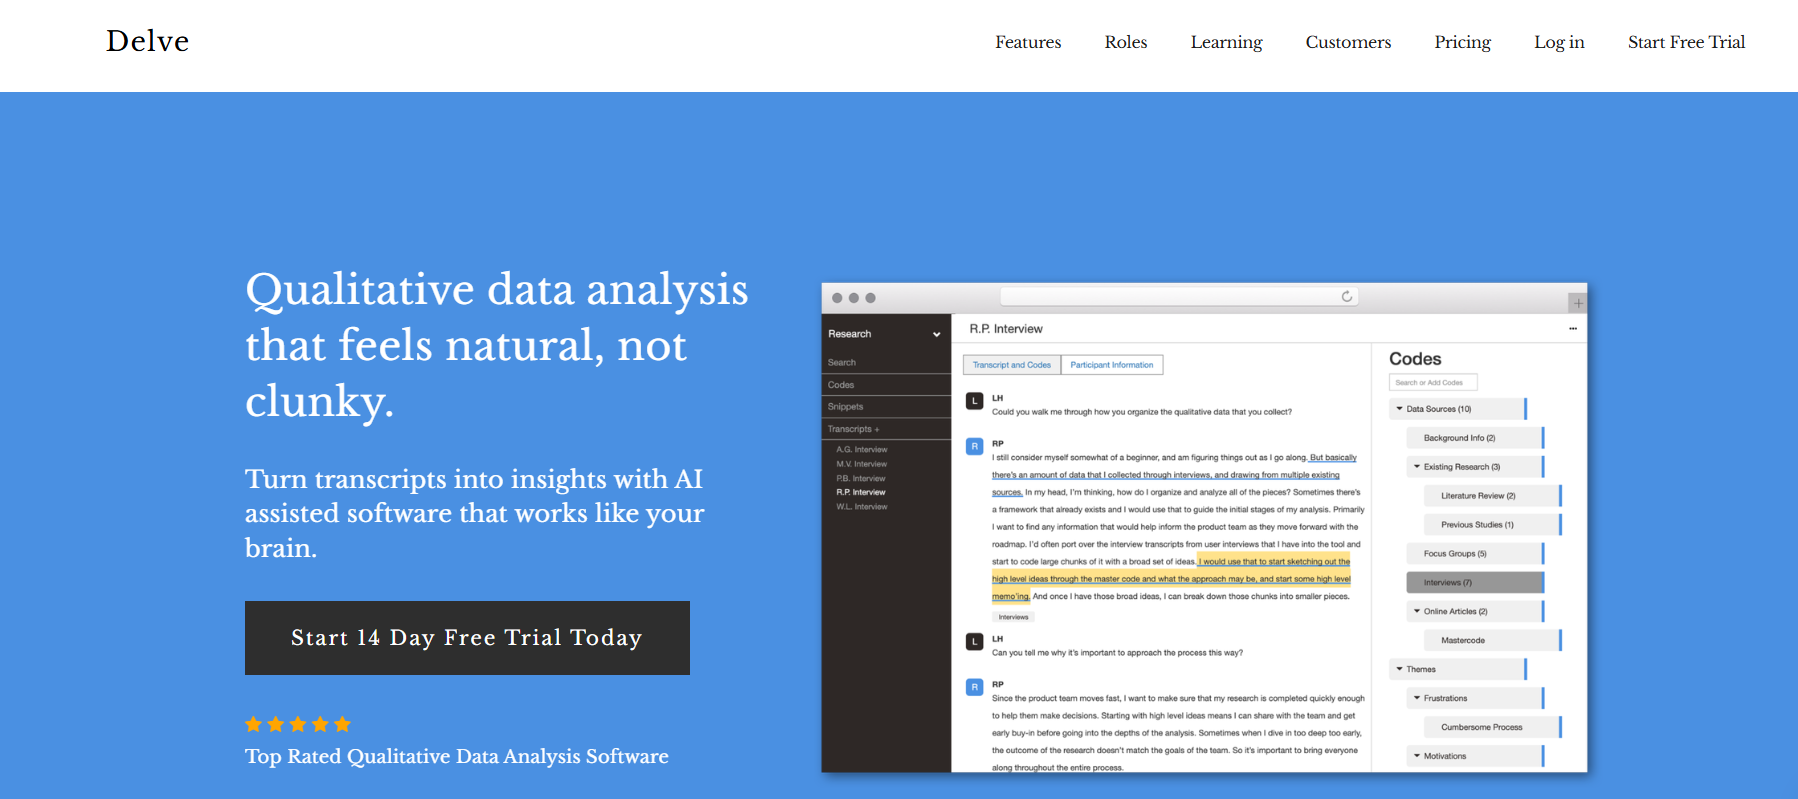
Delve helps your team with code interviews, organizing code, nesting code, merging code, and reviewing related quotes.
Its learning center covers methodologies such as thematic analysis, grounded theory, content analysis, discourse analysis, interpretive phenomenological analysis, semi-structured interview analysis, and mixed methods.
The tool is a practical choice when your team needs to conduct code interviews without installing complex other software or spending weeks learning a large feature set.
Key Features
- Lets your team code transcripts and organize themes through nested codes.
- Includes AI Chat for exploring alternative interpretations and refining codes.
- Supports codebooks, thematic analysis, grounded theory, and narrative analysis.
- Offers a 14-day free trial and method guides for new qualitative researchers.
How Delve Analyzes Qualitative Data
Delve analyzes qualitative data through a focused transcript coding workflow built around codes, categories, quotes, and themes.
Your can code interviews and surveys, build nested codebooks, review related excerpts, and use AI support for code application or theme exploration.
- Add transcripts or survey responses and organize them into a qualitative research project.
- Create codes, nested codes, and codebooks to structure your analysis.
- Apply codes manually or use AI to apply existing codebook definitions to transcripts.
- Review all quotes associated with a code and refine reporting themes.
7. Dedoose — Cloud-Based Mixed Methods Collaboration
Dedoose is a cloud-based application for qualitative and mixed methods data analysis, visualization, and collaboration. It supports interviews, focus groups, documents, survey data, video, images, audio, social media, websites, and other data types in a shared research environment.
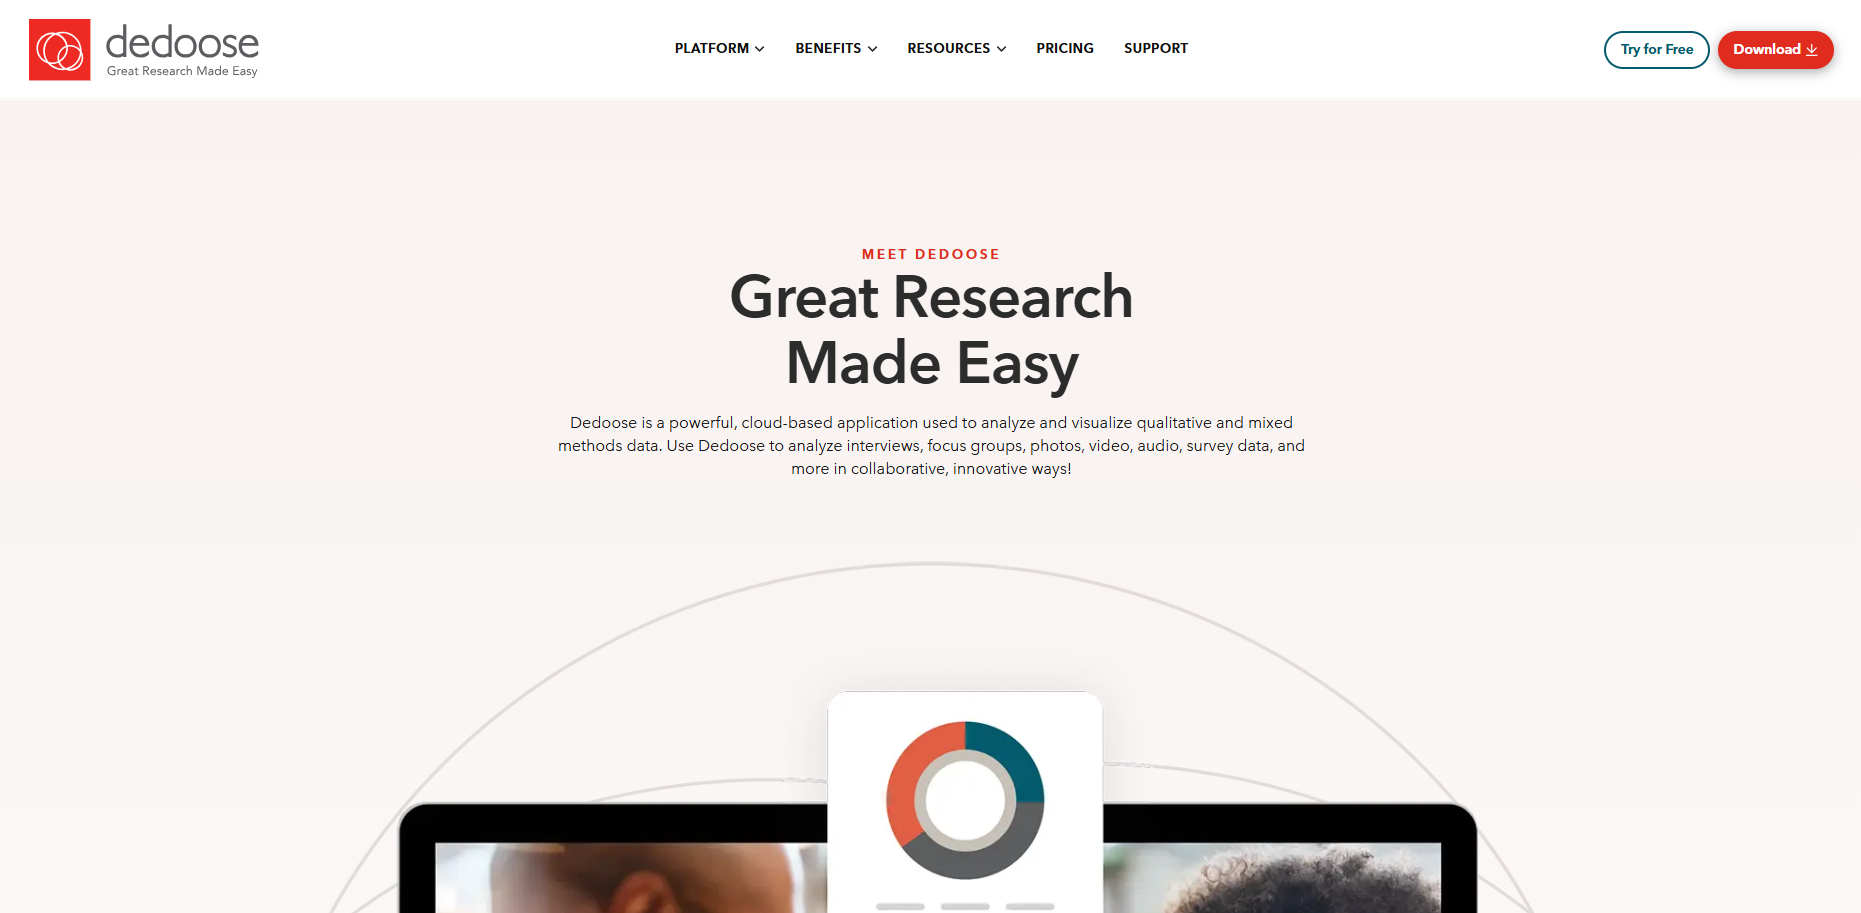
Dedoose is suited to evaluators, health researchers, market and UX researchers, students, teachers, policy researchers, and social scientists who need team access to the same project.
Its real-time collaboration, data visualization, filtering, matrices, Mac and PC compatibility, and cloud-based access make it useful for distributed research teams.
The tool also supports mixed-methods projects in which qualitative codes need to connect to descriptors, segments, or quantitative variables.
Key Features
- Supports interviews, focus groups, documents, survey data, video, images, audio, and websites.
- Enables real-time collaboration with other Dedoose users at no added cost.
- Visualizes qualitative and mixed methods data through charts, graphs, and matrices.
- Filters data by segments, variables, descriptors, and coded patterns.
How Dedoose Analyzes Qualitative Data
Dedoose analyzes qualitative and mixed-method data through cloud-based coding, descriptor fields, team collaboration, and visual analysis.
Your team can code text or media, connect qualitative excerpts to quantitative variables, and use visual tools to explore relationships in the data.
- Upload interviews, focus groups, documents, survey data, images, audio, video, and web materials.
- Build a code tree and apply codes to text segments or media excerpts.
- Add descriptors to compare groups, segments, users, or respondent characteristics.
- Use charts, matrices, filters, and mixed-method views to identify patterns.
8. Quirkos — Visual Coding With a Lower Learning Curve
Quirkos is a visual qualitative data analysis software for teams that want a simpler way to code, organize, and explore qualitative text data. It uses a clean visual interface to help users build themes, tag content, compare responses, and identify patterns while coding.
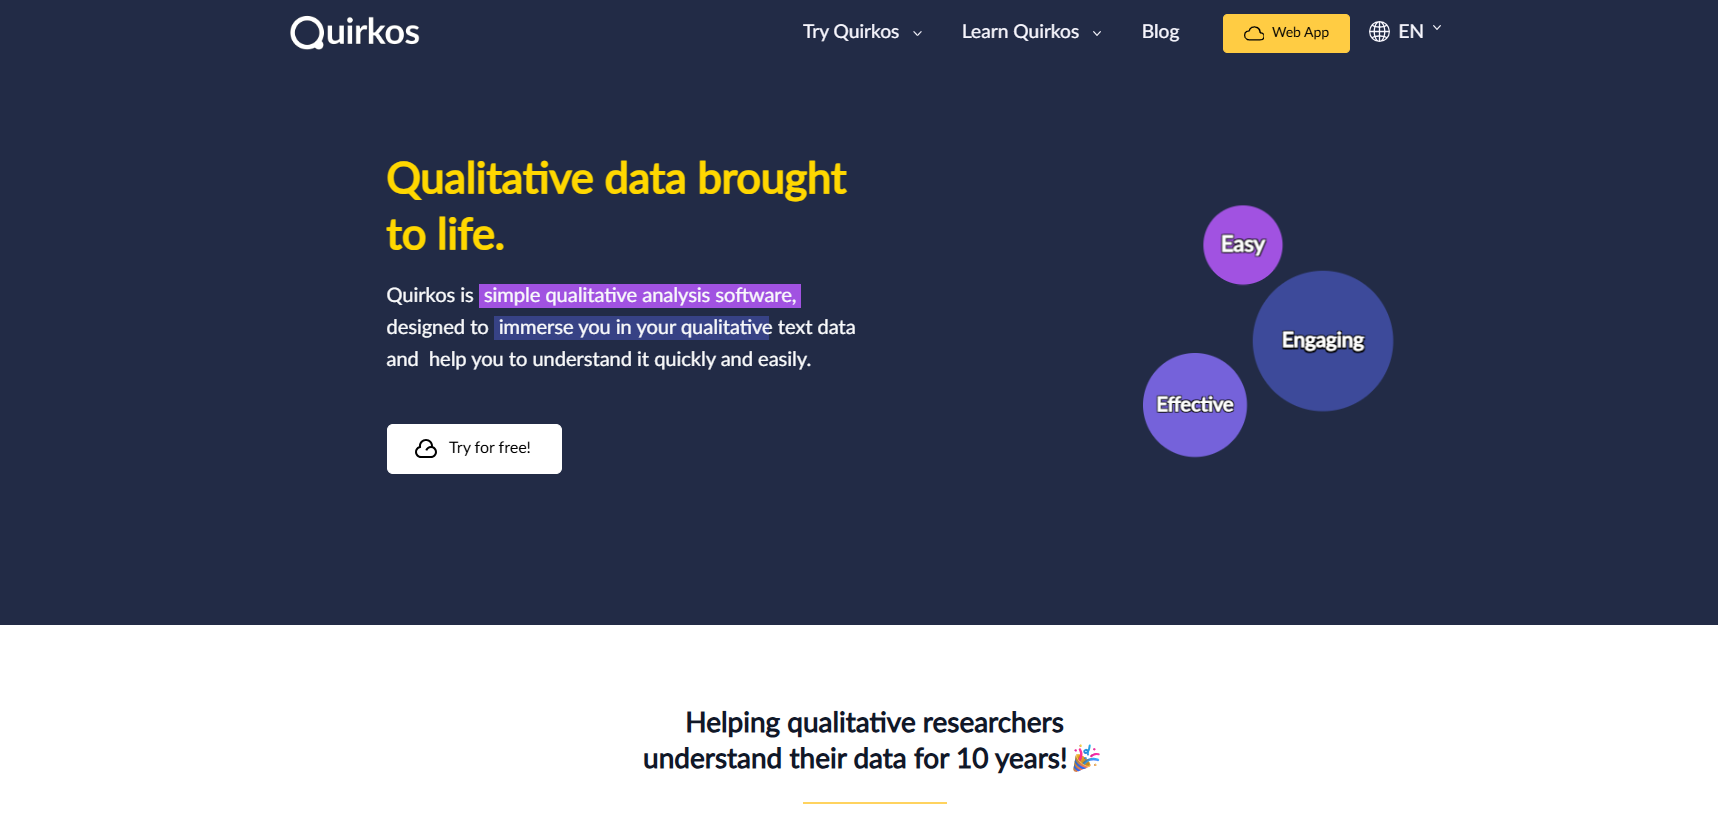
Quirkos supports Word documents, PDFs, plain text, website text, Excel spreadsheets, survey responses, audio, and video through Quirkos Transcribe.
It also supports multilingual text analysis, cloud access, browser-based use, offline desktop work, Mac, Windows, and Linux, phones and tablets, project sharing, live editing, and end-to-end encryption for password-protected projects.
This tool is a helpful choice when your team wants an intuitive way to start qualitative analysis without a steep learning curve.
Key Features
- Imports Word documents, PDFs, text files, Excel sheets, audio, and video transcripts.
- Supports Quirkos Cloud for browser access, project sharing, and live collaboration.
- Works on Mac, Windows, Linux, phones, tablets, and offline desktop setups.
- Includes 100 free transcription minutes during the Quirkos Cloud trial.
How Quirkos Analyzes Qualitative Data
Quirkos analyzes qualitative data through a visual coding interface where themes appear as bubbles that grow as you code more material.
Your team can import text data, create codes, tag excerpts, compare themes, and export coded evidence for further review.
- Import Word documents, PDFs, text files, spreadsheets, surveys, audio, and video transcripts.
- Create visual theme bubbles and code excerpts directly from the source text.
- Compare coded sections by theme, source, participant, or project category.
- Export coded data and summaries for reports, spreadsheets, or deeper analysis.
Turn Qualitative Data Into Clear Research Findings
Qualitative analysis often slows down when transcripts sit in one tool, survey responses sit in another, and final reports live in a separate document. You need a way to connect the source material to the insight that reaches stakeholders.
Compeers AI brings qualitative data analysis into a broader market research workflow.

Your team can move from discussion guides and data collection to coding, sentiment analysis, pattern detection, synthesis, and first-draft reporting without losing the link between each finding and the source material.
You can review AI-assisted outputs, refine the analysis, trace consumer insights back to quotes and data, and create reports that support clearer decisions.
Book a demo to see how Compeers AI connects qualitative analysis with reporting!
FAQs About Qualitative Data Analysis Tools
What are qualitative data analysis tools?
Qualitative data analysis tools help researchers organize, code, analyze, and interpret non-numeric data such as interviews, focus groups, documents, audio, video, images, and survey responses. They support qualitative analysis by helping your team find themes, compare segments, build reports, and turn raw data into actionable insights.
What is the easiest qualitative data analysis tool to learn?
Quirkos and Delve are among the easiest tools to learn because they focus on clear coding workflows, simple interfaces, and basic code organization. Compeers AI is a better fit when your team wants qualitative analysis integrated into project setup, synthesis, and reporting, rather than a standalone coding tool.
Are there free qualitative data analysis tools?
Yes, some free tools, free trials, and open-source options can help with basic qualitative text analysis, but they often have limits in collaboration, reporting, AI support, or complex projects. Compeers AI is built for research teams that need qualitative data analysis integrated with planning, mixed-methods research, traceable synthesis, and first-draft reports.



.svg)
Custom research, reimagined
.svg)
.svg)
.svg)
.svg)